

Lean Six Sigma: Manufacturing Excellence
Situation
A leading power and control product manufacturer has worldwide annual consolidated sales of approximately $9 billion and roughly 200 manufacturing plants worldwide. We worked with a division of the company known for quality switchboards, switch gear, breakers, and other electrical components used in the energy, building, industry, and infrastructure markets.
In the industry, this company is known for its ability to tailor its products to meet the specific needs of its clients. The ability and willingness to customize has given the company a competitive edge while also creating operational challenges. Engineer-to-order (ETO) products with a high degree of variability can often drive long lead time from design to production, large inventories, obsolescence, design control issues, production complexity, and inefficient scheduling, among other problems.
From 1996 to 2001, the highly competitive North America market and economic downturn caused steady margin erosion. In response, the company launched an enterprise-wide initiative to reduce manufacturing costs by 20-25 percent within two years at select manufacturing sites. Further, it set goals to build the skills base necessary to generate lasting continuous improvement, drive consistency in production systems, and optimize key areas of the supply chain.
A major plant in South Carolina was chosen as a key ETO facility for manufacturing cost improvement. With its 258,000 square feet of production space, large dollar opportunity, and products of strategic significance, it was a logical target. We were engaged to understand the current state operation, define improved methods by applying lean techniques, and then do a rapid implementation. The stated goal was to reduce conversion costs by a minimum of 20 percent.
Approach
During the first week of the three-week-long diagnostic phase, we worked with plant personnel to understand the current state of the operation. A number of key findings highlighted the need for dramatic operational improvement. Specifically, it was uncovered that the plant was characterized by:
- Long changeover times
- Excessive work in process (WIP) and raw material
- Excessive active part numbers
- Long lead times
- A functional layout with poor material flow
- High order variability
- Inefficient labor utilization
- Inefficient order entry processes
- High level of overproduction and rework
- High transportation costs.
These underlying issues hindered the company’s performance at the plant level, which diminished the overall corporate operating result. Besides diminished cash-to-cash cycle time efficiency, the plant experienced less than optimal order fulfillment performance, low inventory and asset turns, and high overall supply chain costs.
Solutions
During the second and third weeks of the diagnostic phase, we defined a number of key levers for significant conversion cost savings. To conduct the diagnosis and quantify tangible savings, a number of tools and techniques were used. For example, value stream maps were created for both the current state and envisioned future state of the facility. Besides providing powerful visuals of the operations, these maps were used to quantify cycle times, inventory levels, number of operators, and the ratios of productive times to lead times. Another key analysis looked at the demand data to understand the volume/product/order mix. By coming to grips with the level of variation, smarter scheduling and better flow techniques could be devised. Other analyses and tools used included personnel interviews, timed observations, Pareto analysis, and regression analysis.
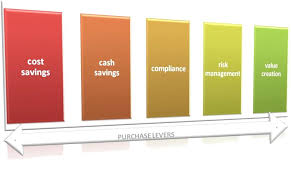
In Figure 1, the levers for savings and associated key activities are detailed.
At the core of lean is speed. Process cycle time efficiency is the overall defining lean metric that paints the picture of a manufacturing plant’s health. By applying lean principles, we were able to identify ways to dramatically improve cycle time efficiency, which pointed the way to a 21 percent reduction in conversion costs. Recommendations focused on several key areas including improved material handling through a revised layout, reduced touches and dedicated handlers, reduced changeover times through standardized work, a flexible workforce operating within a flowing cellular line, and a scheduling system based on customer pull rather than forecasted push. In addition, we recommended implementing a constant daily output (CDO) system to produce the high-volume products to a schedule. Instead of ramping production up and down in response to order volume, production of high-volume material would be leveled based on order volume history.
Results
Having identified what to fix, the next step was to put together a workable rollout plan and begin implementation. Before the diagnostic, the pervasive culture at the South Carolina plant was typical. There was a lack of urgency for improving things; inefficiencies were accepted as the normal mode of operation. One of the by-products of the three-week diagnostic phase was an awakening among plant personnel. By including plant personnel as an integral part of the diagnostic process, new possibilities became apparent to them. Word spread and when it came time for implementation, there was more of a willingness to change. The approach is designed to obtain significant results within 10 weeks, achieve more than 50 percent of the targeted savings within 6 months, and foster a culture of continuous change.
Figure-1
At the South Carolina plant, number of dramatic changes were made which resulted in significant savings in a relatively short time. Within the first 10 weeks, over 40 percent of the targeted 6-month goal was achieved, 30 percent greater than what was predicted.
Numerous changes were implemented to increase efficiency and reduce inventory. A pull approach was employed to reduce WIP by employing a build trigger for the main structure. Before the implementation, structures and a related component were scheduled separately and were connected together at an area called plug-in. This created WIP of structures and the components waiting for mates. By triggering the structure build when the component was done, the structure WIP at plug-in was dramatically reduced. In addition, the entire structure line was redesigned to balance the stations, shorten the cycle time, reduce space, and reduce the raw material inventory needed at the line. Production space was reduced by introducing U-shaped work cells in both the structure line and wiring areas.
In the wiring area, electronic work instructions were employed to enable the wirers to always have the latest revision print, reducing rework as well as part shortages. To gain further efficiency and reduce unnecessary material handling, kitting and “milk run” concepts were implemented. With these techniques, fewer operators were needed as productivity rose with more time on task.
A cellular layout based on material flow and capacity analysis was created for the fabrication area. Changeover times were greatly reduced by division of internal and external work content to maximize operator value-add time. Further, a CDO scheme was implemented to help reduce the effects of variability. Level loading of fabrication production was accomplished by observing the 80/20 rule where 80 percent of the volume is driven by 20 percent of the part types. For the remaining 20 percent of the volume, which reflected special customer orders, lead time was greatly reduced by using a supermarket to provide a buffer to demand variability. The supermarket technique enabled a lead time reduction from 6 down to 2 days.
Scrap reduction of over $40,000 per month was accomplished via coil rebanding. At the plant, raw material arrives on a coil. When a part type is finished at its CDO quantity, the coil is taken off the press and rebanded instead of becoming scrap. Before the re-banding implementation, 21 percent of raw material became scrap. Improvements in the tool crib resulted in another $100,000 in inventory reduction.
Implementation of actionable performance metrics solidified the overall gains and instilled a culture of continuous improvement. The metrics enabled a focus on reducing waste and empowered operators at the cellular level. Key performance indicators (KPIs) are now tracked at the plant level, the department level, and the cell level to illuminate cost/efficiency, service level, quality, and continuous improvement. Examples of KPI’s implemented include CDO stability, supermarket space requirements, planned schedule versus actual, and the percent of good parts out.
Looking forward, the outlook for further improvement is bright. This project demonstrated the power of manufacturing in the U.S. and the possibility to reinvigorate manufacturing capability with practical, focused Lean Six Sigma.
 Twitter
 LinkedIn
 Facebook